この記事は Grafana Advent Calendar 2025 の 11日目になります。
Grafanaを使っていて、こんな経験ありませんか?
- 「昨日まで動いてたダッシュボード、誰か変えた?」
- 「元に戻したいけど、どこをどう変えたか分からない…」
- 「本番と検証環境でダッシュボードの差分が出てきた」
これまでGrafanaには、ダッシュボードをGitで同期するネイティブな機能がありませんでした。 そのため、ダッシュボードを一度JSONにエクスポートしてからGitで管理したり、Terraformや Grizzly(現在は非推奨)などの外部ツールを使ったり、 API経由で自前のスクリプトを書いたりと、なかなか手間がかかっていました。
そんな中、Grafana 12でついにGit Sync機能が登場しました。
Git Syncとは
Git Syncは、GrafanaのダッシュボードをGitHubリポジトリと双方向で同期する機能です。 ダッシュボードはJSON形式でリポジトリに保存され、通常のコードと同じようにバージョン管理できます。
主にできることは以下の3つです:
- Gitベースの管理 - ダッシュボードの変更履歴を追跡し、いつでも過去の状態に戻せる
- PRベースのレビュー - 変更をプルリクエストで確認してからマージ
- マルチ環境デプロイ - 同じダッシュボードを複数のGrafanaインスタンスに展開
同期のタイミングは、デフォルトで60秒ごとのポーリングですが、Webhooksを設定すればほぼリアルタイムで同期できます。
現在のステータス
Git Syncは、2025年12月現在、Grafana OSS/Enterpriseで**Experimental(実験的機能)**として提供されています。
利用するには以下の条件を満たしている必要があります
- Grafana v12以上
- Feature Togglesを有効化
⚠️ 注意: 現時点ではまだ実験的な機能です。本番環境での利用は推奨されていません。ステージング環境で試すことをお勧めします。
セットアップ手順
ここからは、実際にGit Syncをセットアップする手順を詳しく解説します。
全体の流れは以下の通りです:
前提条件
- Docker がインストールされていること
- Grafana v12以上 のDockerイメージ
- GitHubリポジトリ(ダッシュボードを保存する場所)
1. Feature Toggles の有効化
Git Syncを使うために、Feature Togglesを有効にします。
grafana.ini ファイルを作成し、以下の内容を記述します:
[feature_toggles]
provisioning = true
kubernetesDashboards = true
このファイルをコンテナにマウントしてGrafanaを起動します:
docker run -d \
  --name grafana \
  -p 3000:3000 \
  -v $(pwd)/grafana.ini:/etc/grafana/grafana.ini \
  grafana/grafana:nightly
既存のコンテナがある場合は再起動します:
docker restart grafana
2. GitHub Access Token の作成
Git SyncがGitHubリポジトリにアクセスするために、Personal Access Token (PAT) を作成します。
Step 1: GitHubでトークンを作成
GitHub Fine-grained Personal Access Token のページを開きます。
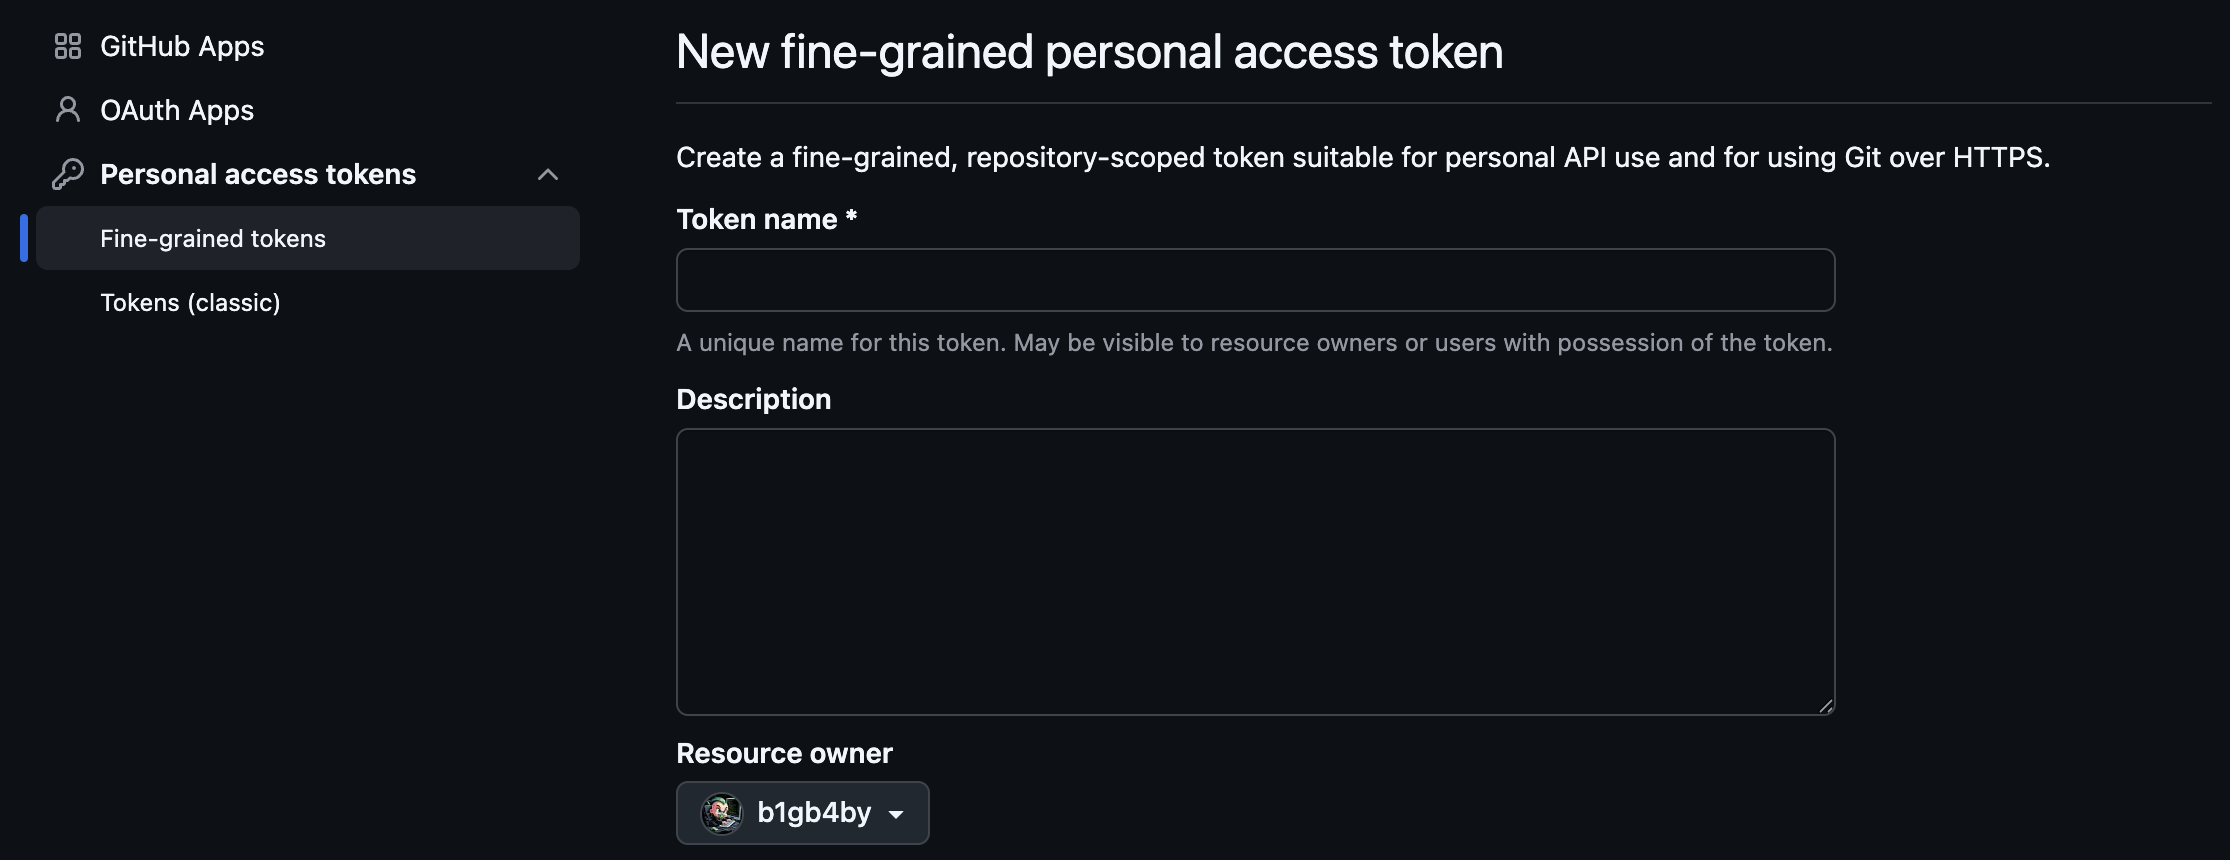
Step 2: トークンの設定
以下のように設定します:
- Token name: 分かりやすい名前(例:
grafana-git-sync) - Expiration: 適切な有効期限を選択
- Repository access: 対象のリポジトリを選択
Step 3: 権限の設定
「Repository permissions」を展開し、以下の権限を設定します:
| 権限 | 必要なアクセスレベル | 用途 |
|---|---|---|
| Contents | Read and write | ダッシュボードJSONの読み書き |
| Metadata | Read-only | リポジトリ情報の取得 |
| Pull requests | Read and write | PRの作成・更新 |
| Webhooks | Read and write | Webhooksの設定(オプション) |
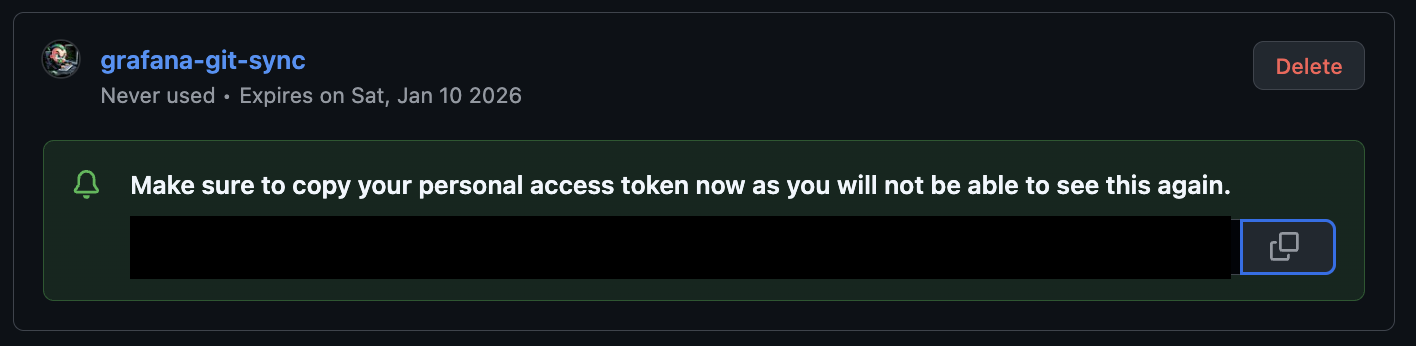
Step 4: トークンの生成とコピー
「Generate token」をクリックし、表示されたトークンをコピーします。
⚠️ 重要: トークンは一度しか表示されません。必ずコピーして安全な場所に保存してください。
3. リポジトリの接続設定
Grafana UIからGitHubリポジトリに接続します。
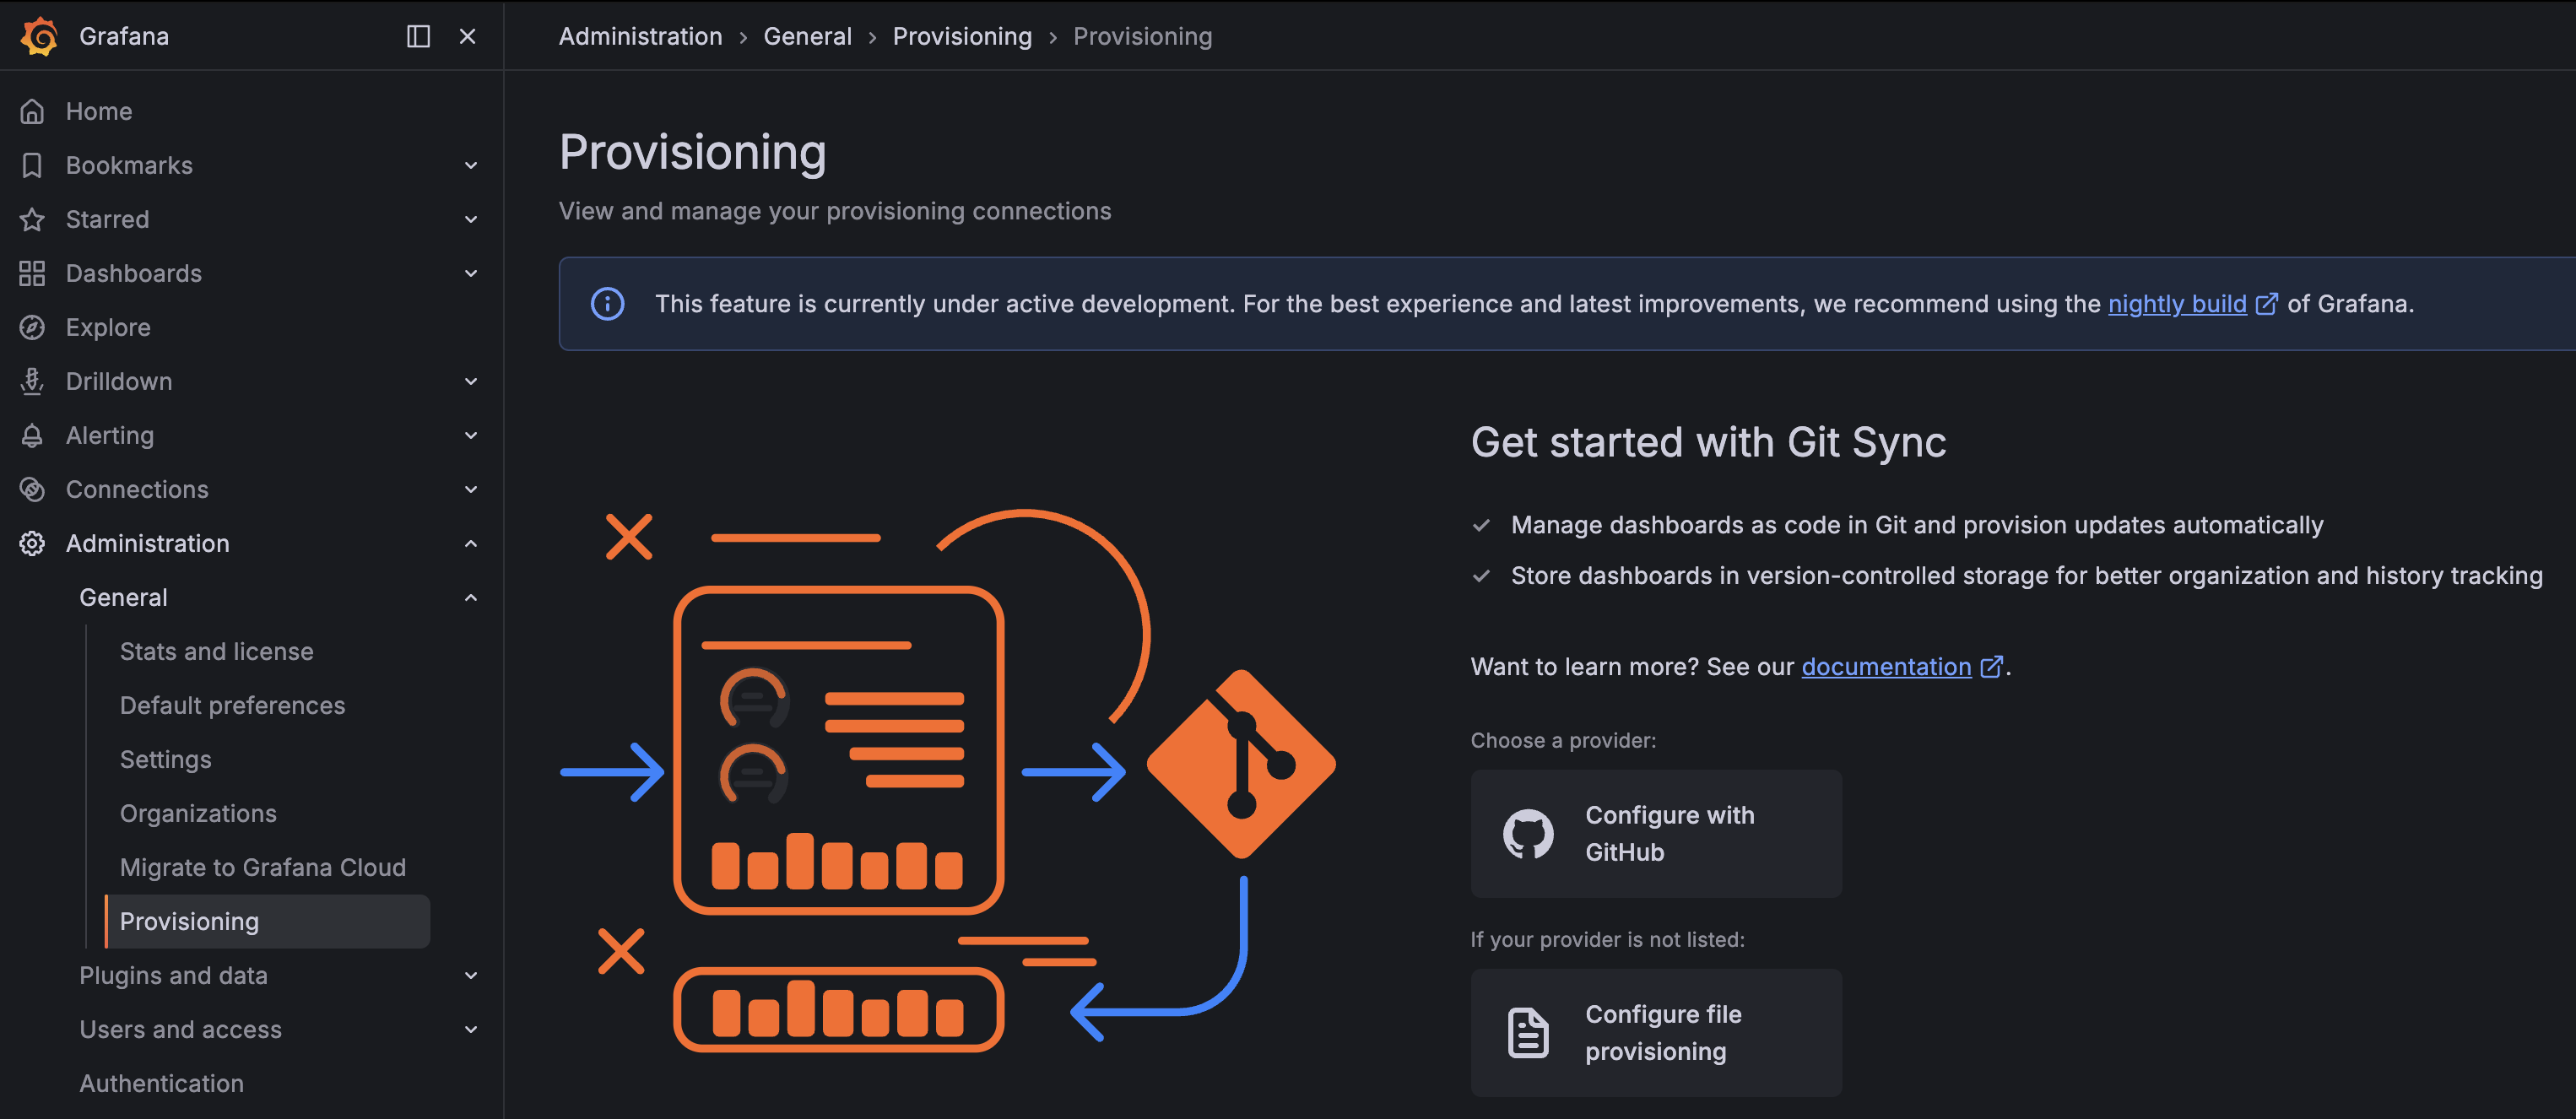
Step 1: Provisioning画面を開く
- Grafanaに管理者アカウントでログイン
- 左メニューから Administration → General → Provisioning を選択
- Configure with GitHub をクリック
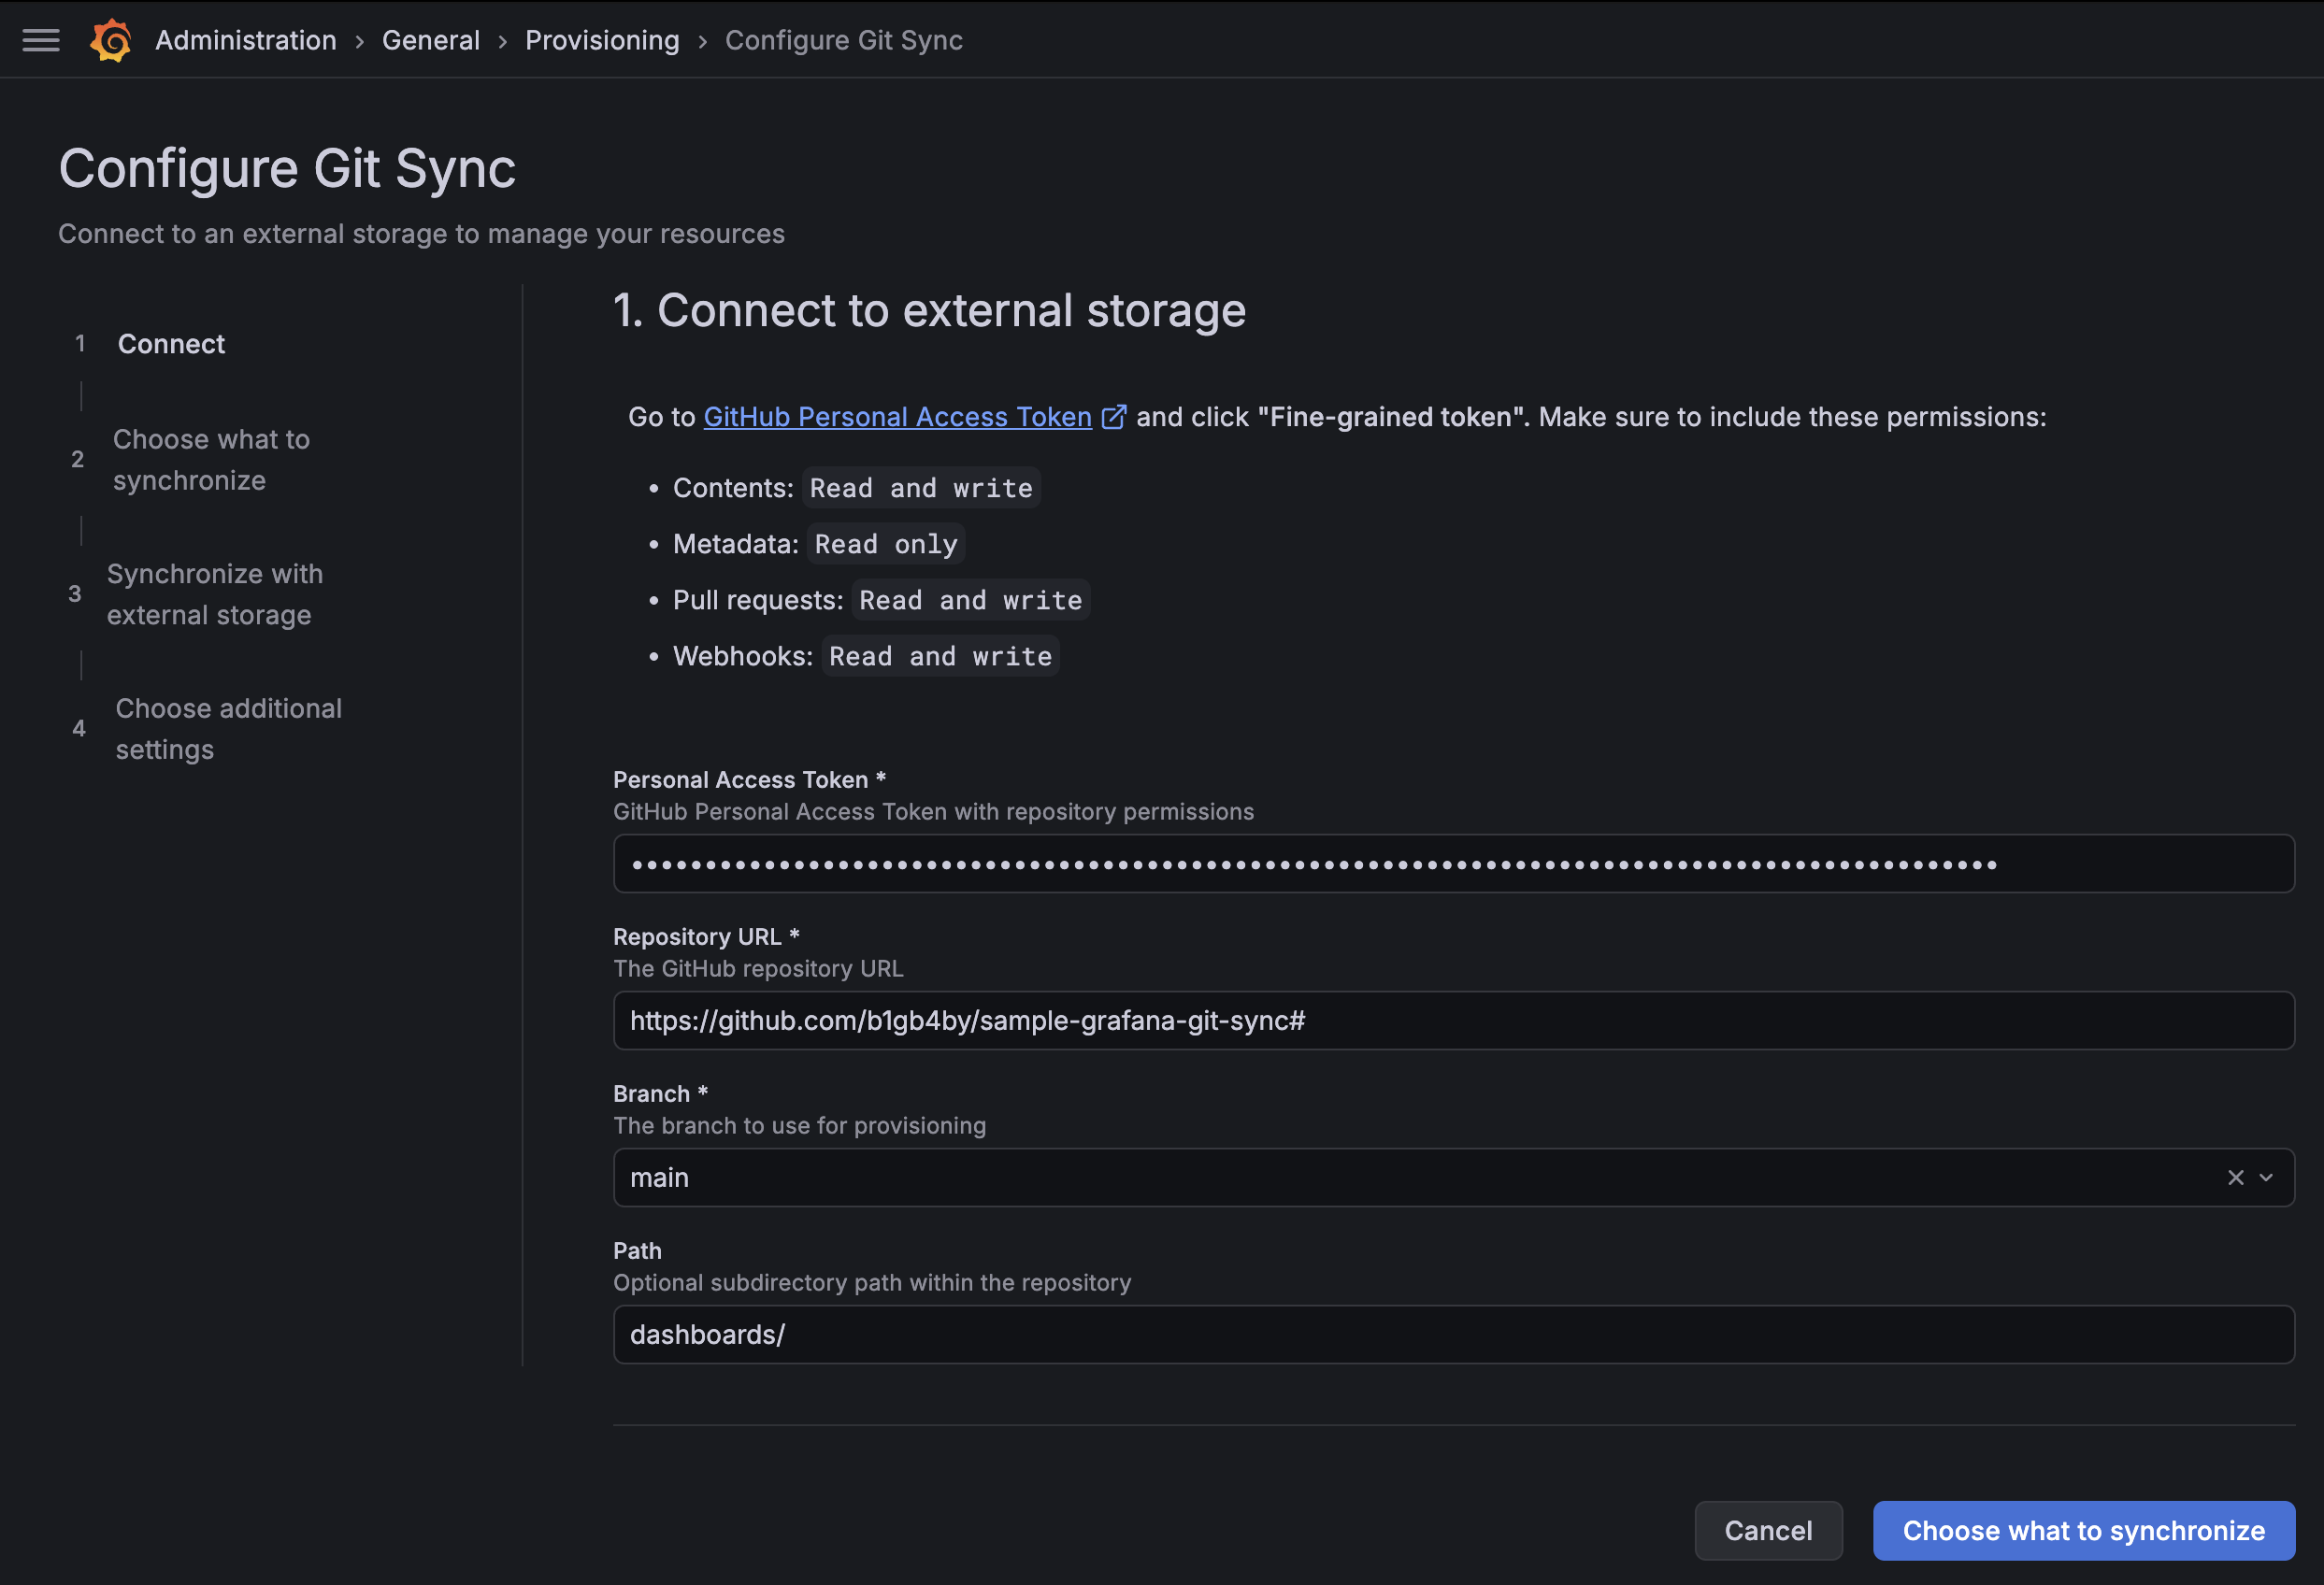
Step 2: 接続情報を入力
以下の情報を入力します:
| 項目 | 説明 | 例 |
|---|---|---|
| Access Token | 先ほど作成したGitHub PAT | ghp_xxxxxxxxxxxx |
| Repository URL | GitHubリポジトリのURL | https://github.com/your-org/grafana-dashboards |
| Branch | 使用するブランチ | main |
| Path | ダッシュボードを保存するディレクトリ | dashboards/ (ルートの場合は空欄) |

Pathは任意のディレクトリを指定可能なので、今回はdashboardsディレクトリを指定しています。
上記の情報を入力後、「Choose what to synchronize」をクリックして次へ進みます。
4. 同期するコンテンツの選択
同期の方法を選択します。2つのオプションがあります:
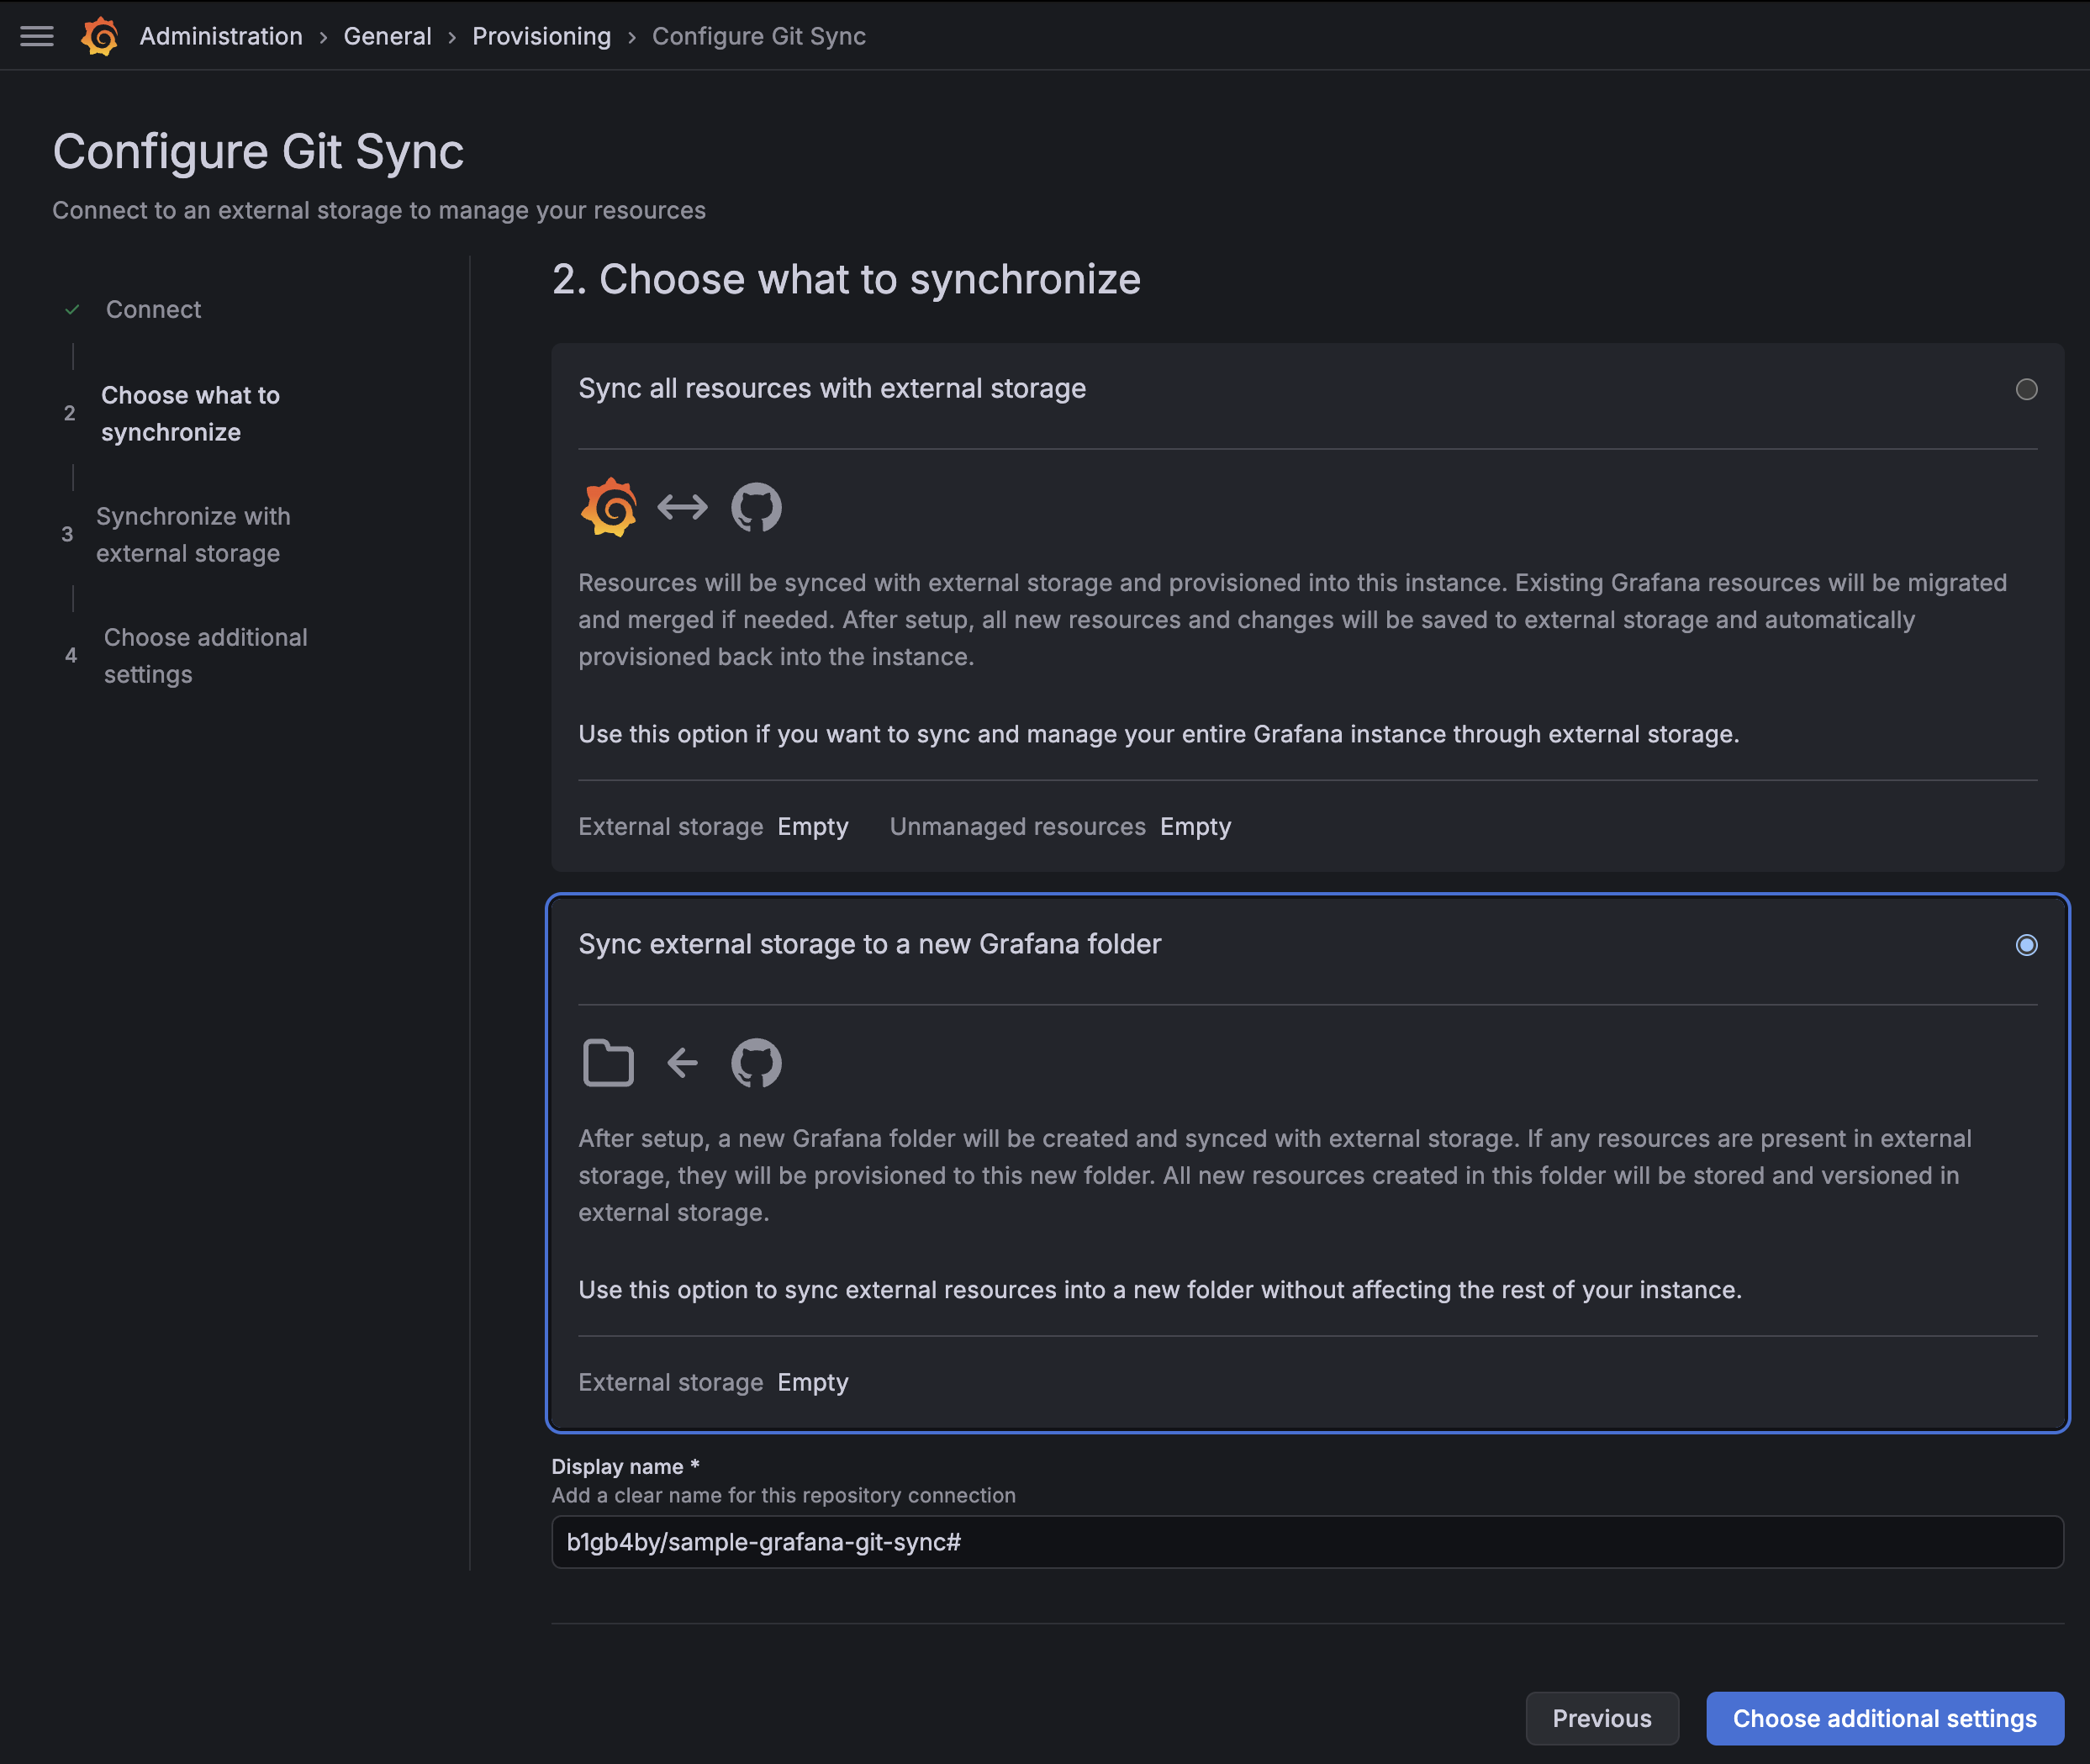
オプション A: 全リソースを同期 (Full Instance Sync)
Sync all resources with external storage
- Grafanaインスタンス全体のダッシュボードをリポジトリと同期
- 1つのリポジトリ接続のみ設定可能
- 既存のアラートやライブラリパネルがあるとブロックされる
オプション B: フォルダ単位で同期 (Folder Sync)
Sync external storage to new Grafana folder
- 指定したフォルダにリポジトリの内容を同期
- 最大10個のリポジトリ接続が可能
- 既存のダッシュボードに影響を与えない
初めて試す場合は オプション B(フォルダ同期) がおすすめです。既存の環境への影響が少なく、安全に試せます。
Display name を入力して、「Choose additional settings」をクリックします。
今回は同期するコンテンツが存在しないため、「3. Synchronize with external storage」はスキップされます。既存のダッシュボードがある場合は、ここで同期処理が実行されます。
筆者の環境では、同期処理中にブラウザがクラッシュする現象が発生しました。原因は調査中ですが、うまく動作しなかったので今回は省略します。
5. 追加設定
最後に、同期の動作をカスタマイズできます:
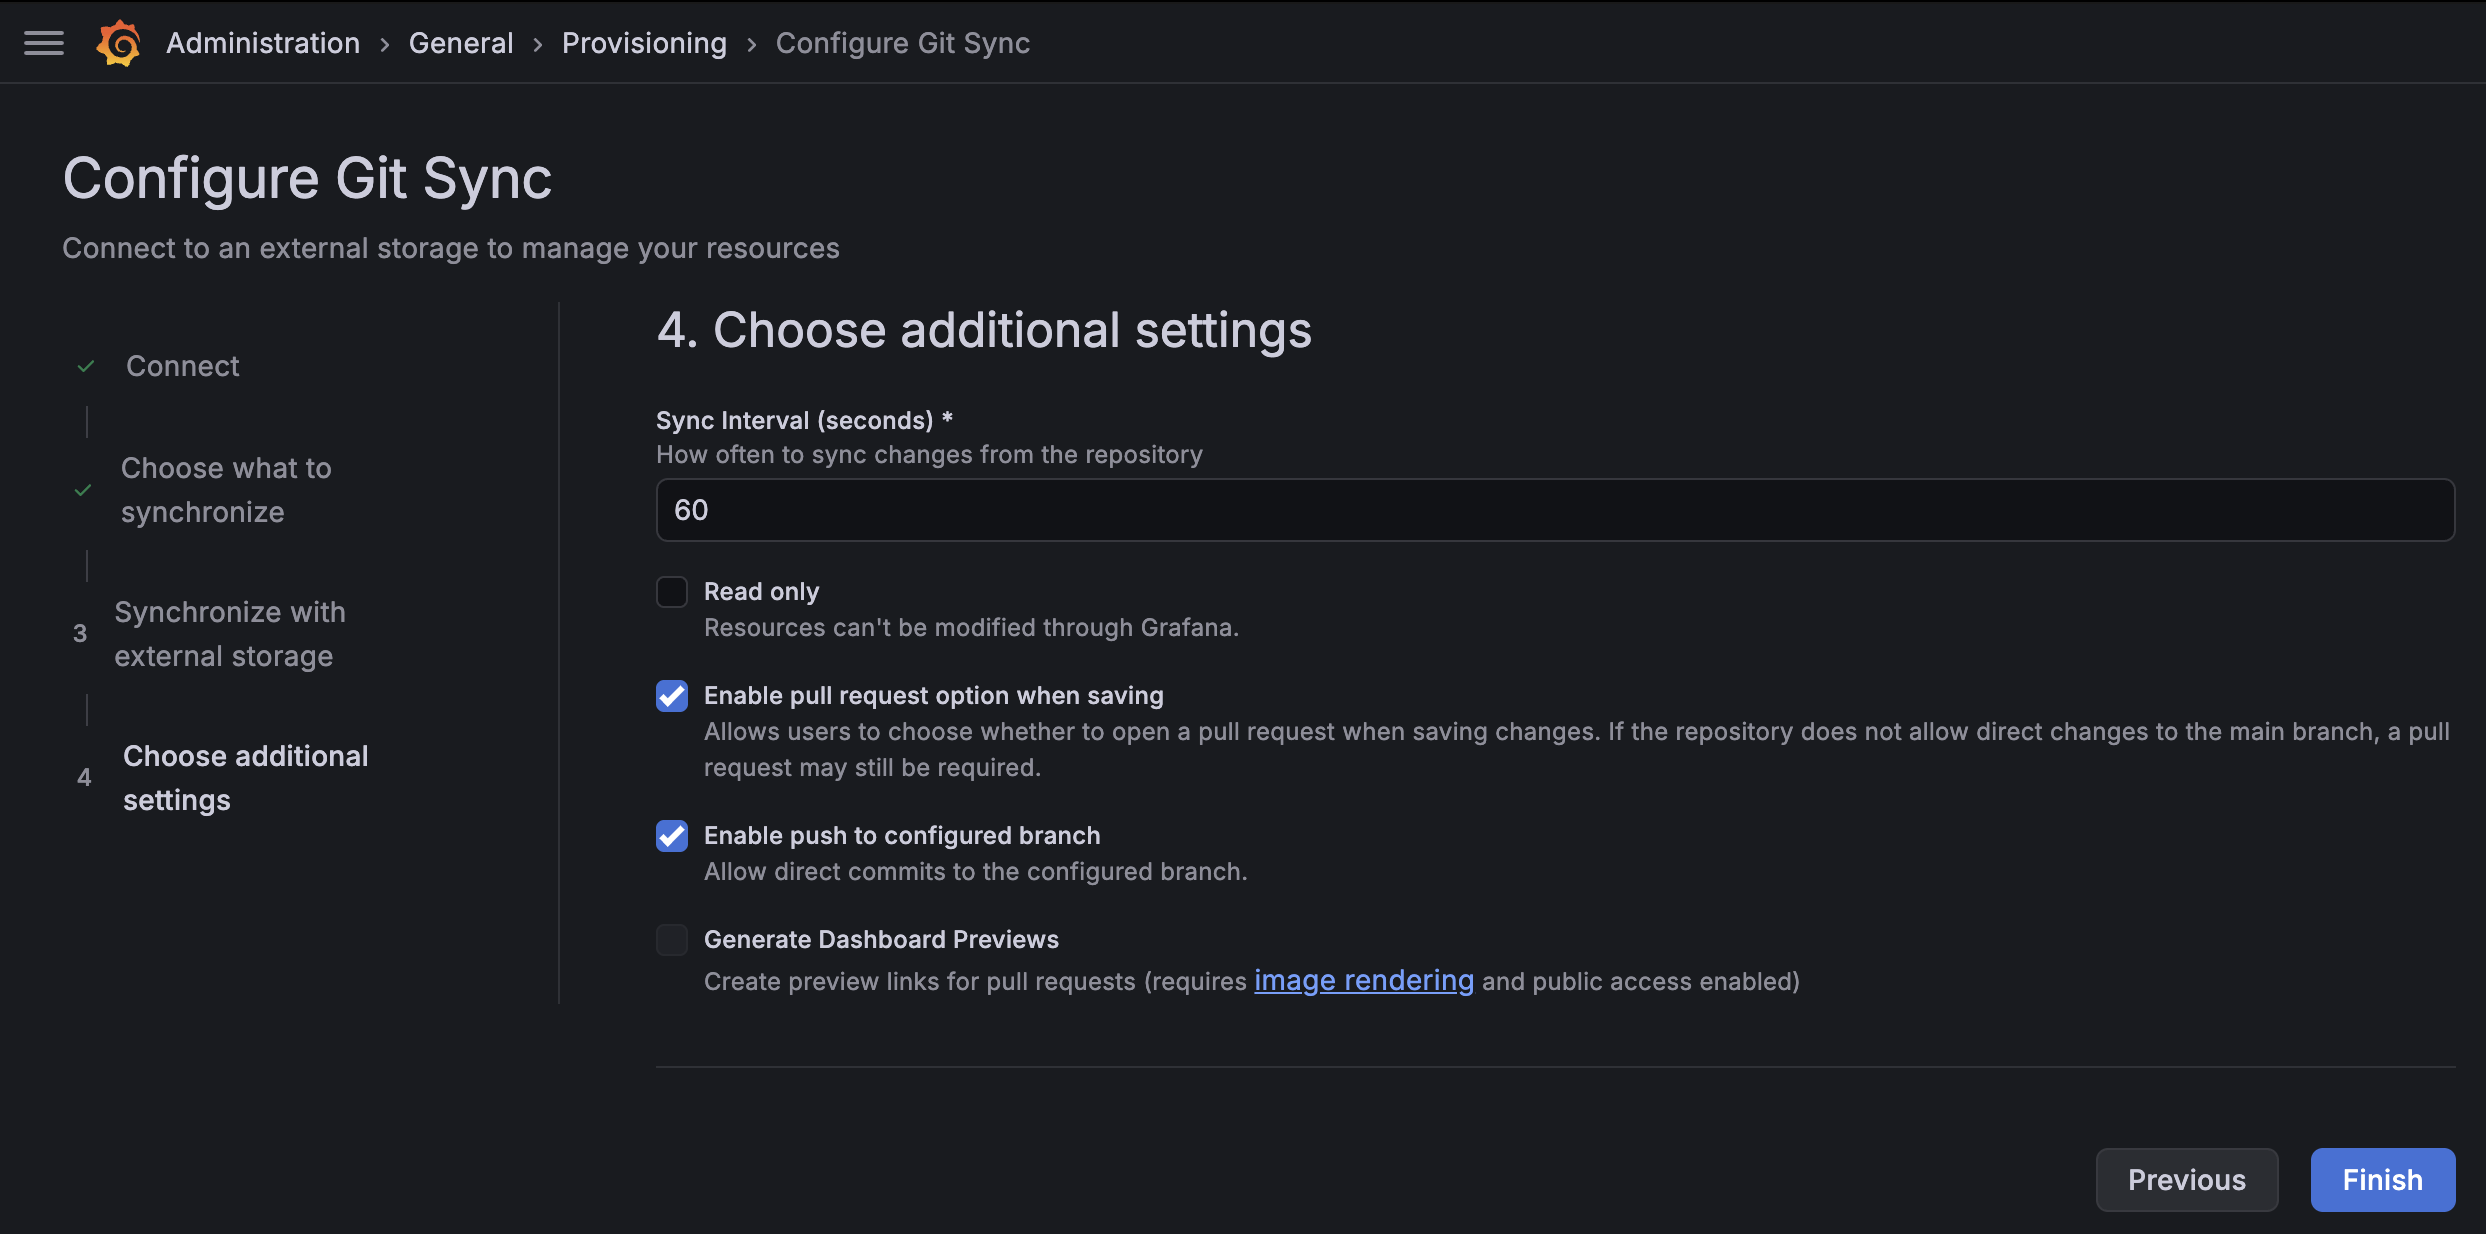
| 設定項目 | 説明 | デフォルト値 |
|---|---|---|
| Sync Interval (seconds) | リポジトリをポーリングする間隔(秒) | 60 |
| Read only | Grafana UIからの編集を禁止 | オフ |
| Enable pull request option when saving | 保存時にPRを作成するか選択できるようにする | オン |
| Enable push to configured branch | 設定したブランチへの直接コミットを許可 | オン |
| Generate Dashboard Previews | PRにプレビューリンクを生成(Image Renderer + パブリックアクセスが必要) | オフ |
「Finish」をクリックしてセットアップ完了です!
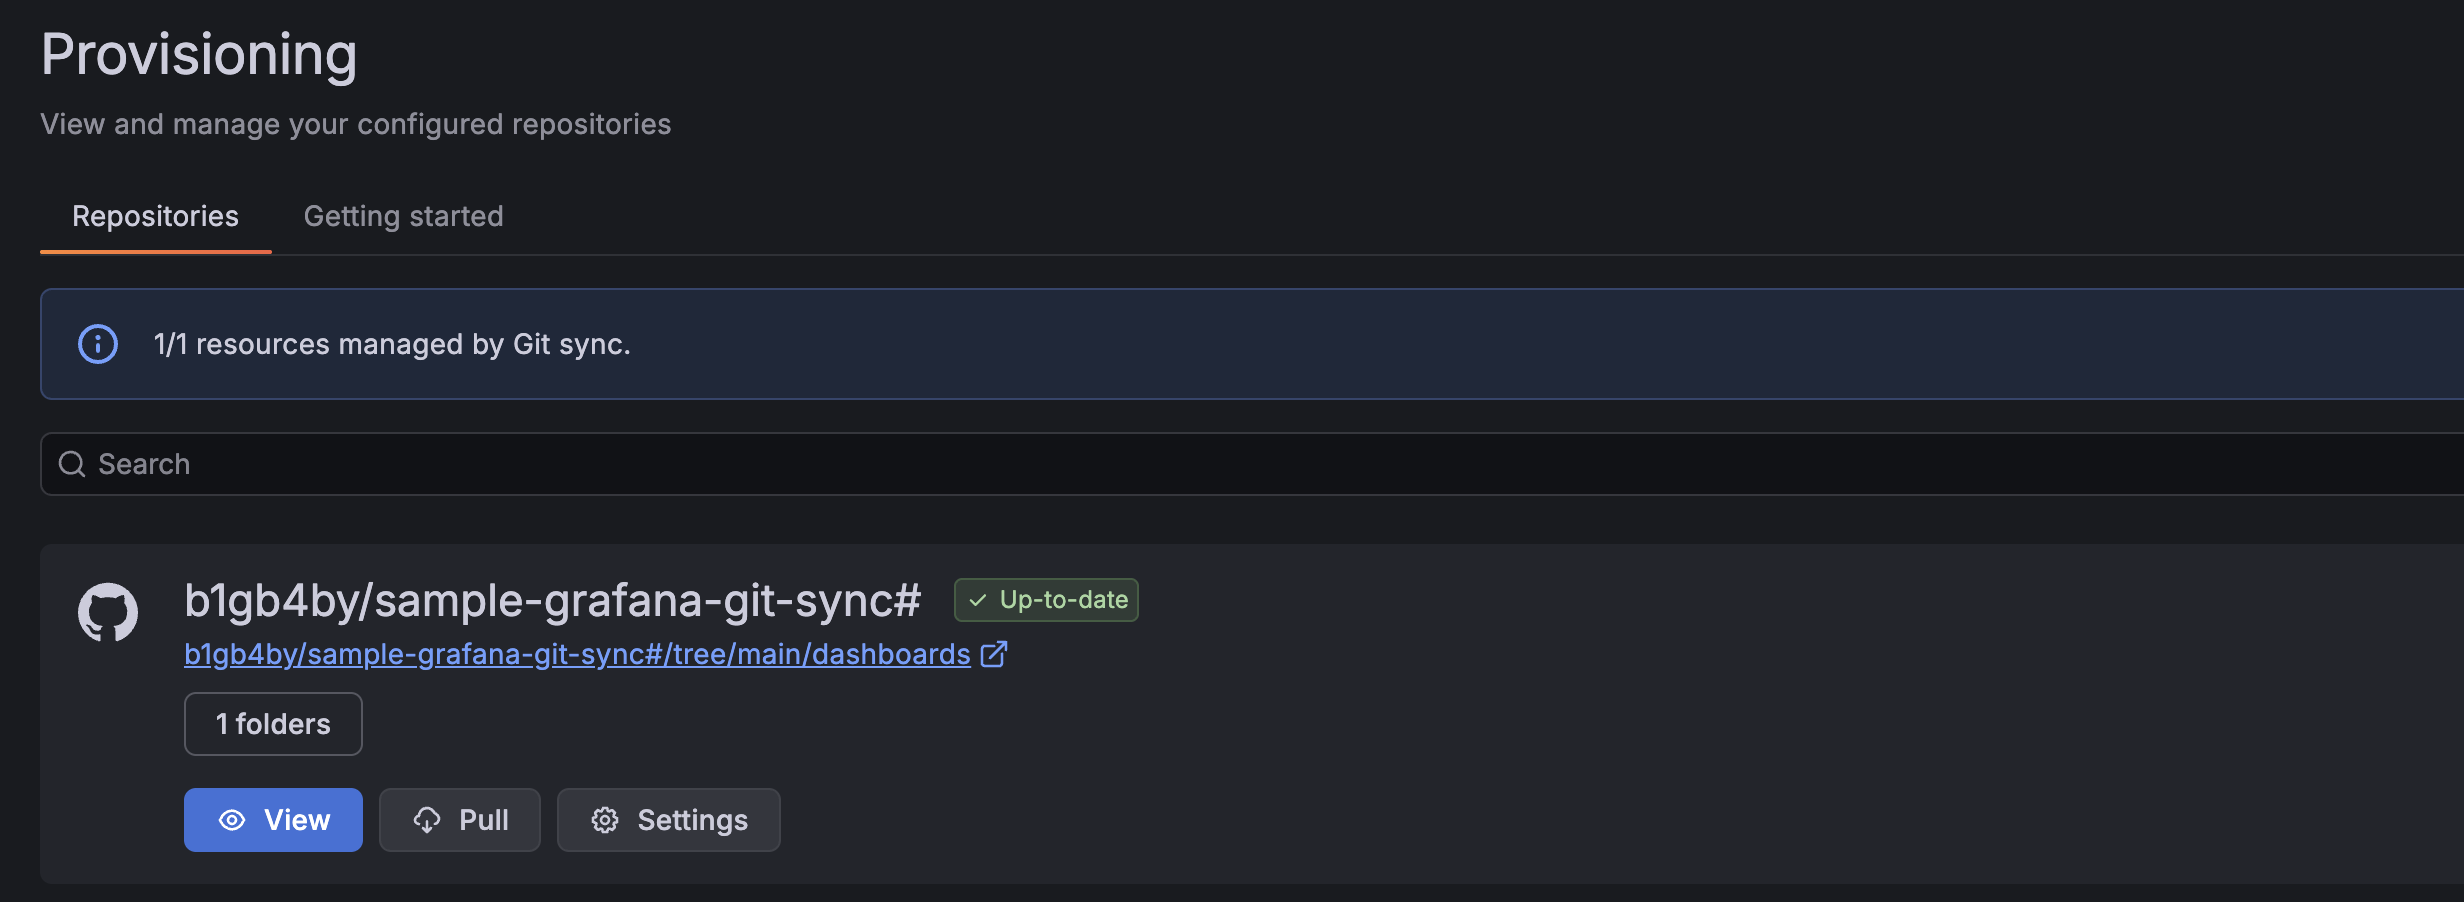
セットアップの確認
セットアップが完了したら、以下を確認しましょう:
- Dashboards メニューを開く
- 設定した Display name のフォルダが表示されていることを確認
- リポジトリにダッシュボードJSONがある場合、インポートされていることを確認
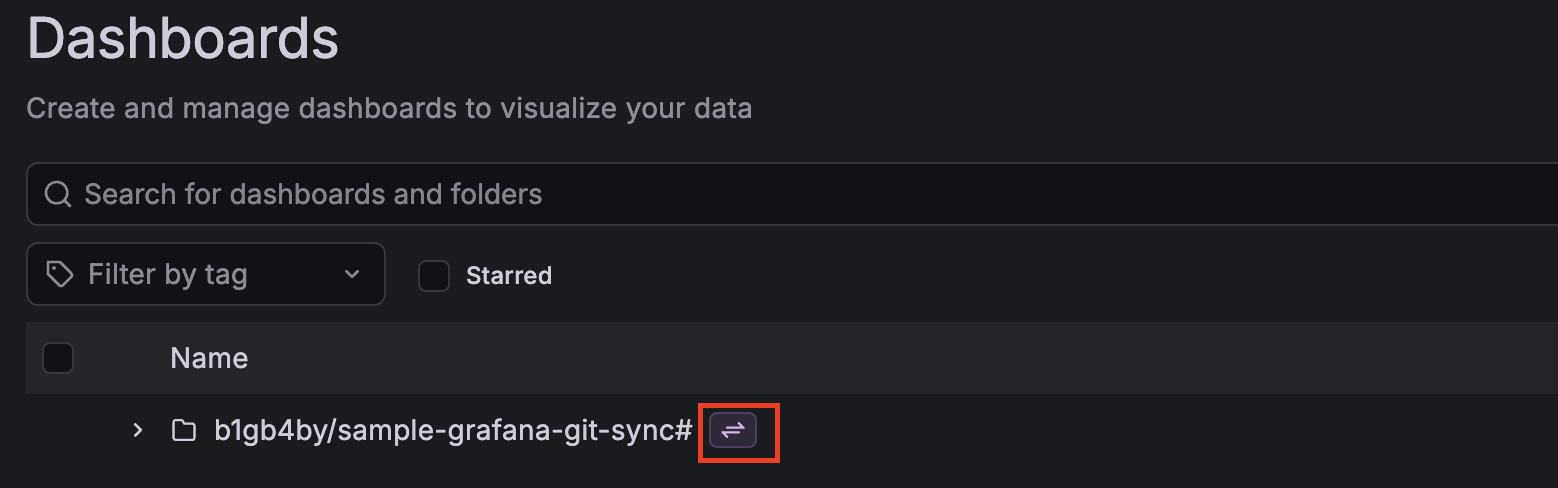
Git Syncで同期されたダッシュボードには下図のようなアイコンが表示されます。
実際の使用例
Git Syncをセットアップした後の、実際のワークフローを見ていきましょう。
ざっくり3つのケースがあるかな?と思っています。
ケース1: Grafana UIでダッシュボードを編集 → GitHubに反映
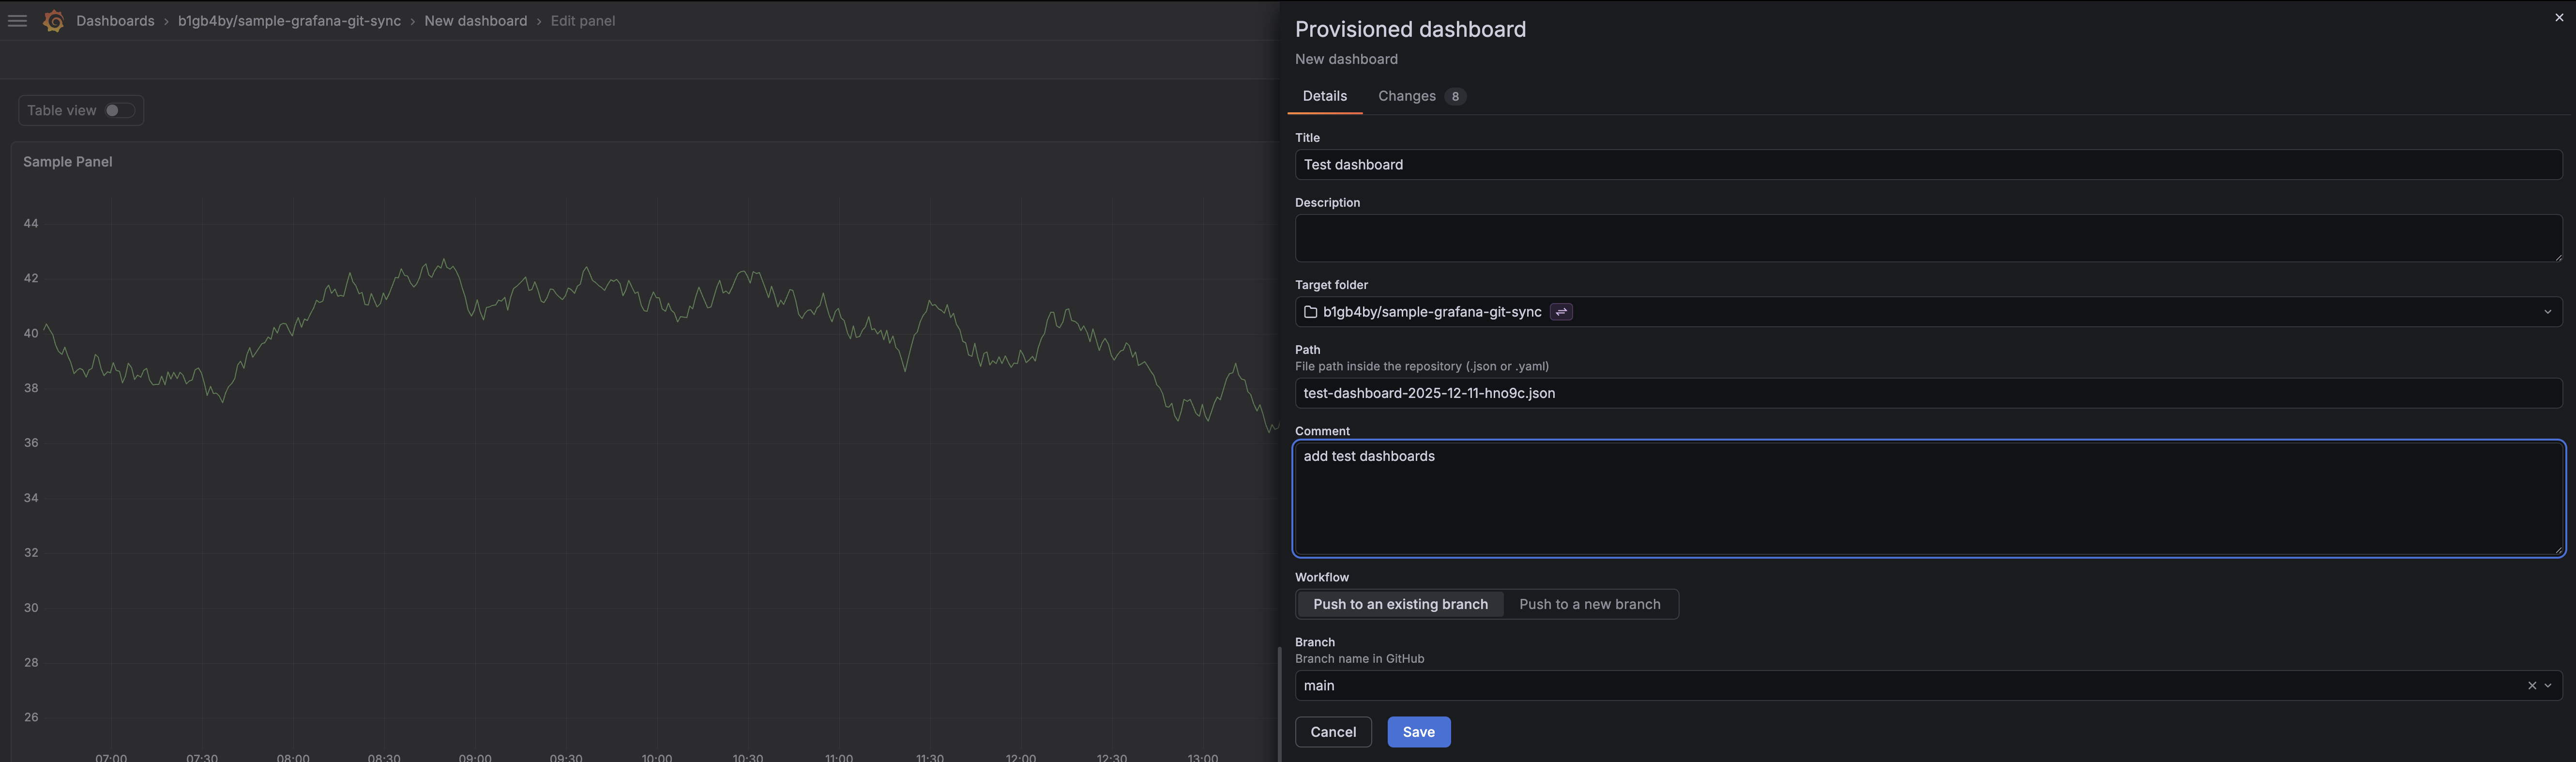
- Grafana UIでダッシュボードを編集
- 通常通りダッシュボードを編集します
- 保存時に、ファイル名、コミットメッセージ、コミットするブランチなどを指定することが可能です
変更がGitHubに自動的に反映
- ダッシュボードを保存後、設定したポーリング間隔でリポジトリが更新されます
- または、「Save to GitHub」オプションで即座にコミット
コミット履歴で変更を確認
- GitHubリポジトリで変更履歴を確認してみましょう
- 設定した、ファイル名とコミットメッセージでコミットされていることが確認できます
- GitHubリポジトリで変更履歴を確認してみましょう
ケース2: GitHubでダッシュボードを編集 → Grafanaに反映
JSONファイルを直接編集
- リポジトリ内のダッシュボードJSONを編集してみましょう
- 今回はシンプルにダッシュボードの名前を更新してみました
- 編集後は、コミットしてリポジトリにプッシュします
- リポジトリ内のダッシュボードJSONを編集してみましょう
Grafanaが自動的に同期
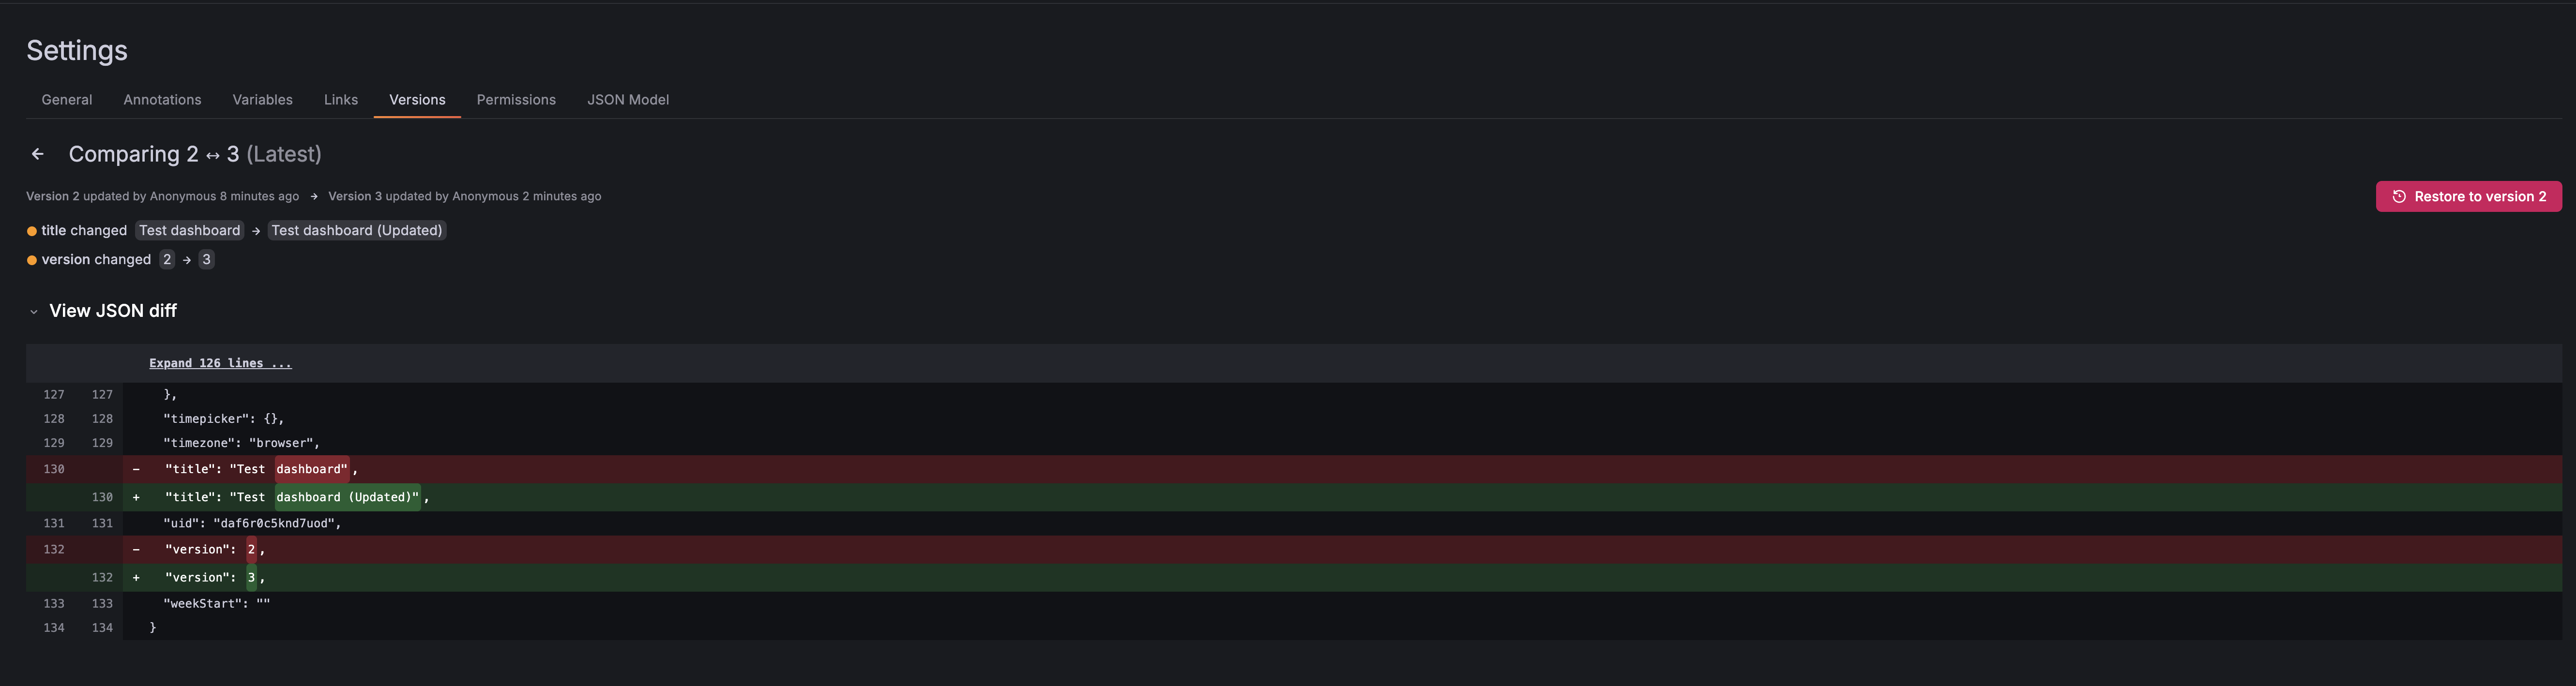
- ポーリング間隔後にGrafanaにダッシュボードが反映されます
- 実際にダッシュボードが更新されたかを確認してみると、きちんと差分が取り込まれていることが確認できます
- Webhooks設定済みならほぼリアルタイムで更新されます
- ポーリング間隔後にGrafanaにダッシュボードが反映されます
ケース3: PRベースのレビューワークフロー
Generate Dashboard Previewsを有効化しておくと、以下のような形でPR時にダッシュボードのレビューを行うことができます。
この方法のメリットは以下のとおりです:
- 変更前にダッシュボードのレビューが可能
- Image Renderer設定済みなら、PRにダッシュボードのプレビュー画像が自動添付
- 問題があれば簡単にRevertが可能
試してみようと思いましたが、こちらも筆者の環境ではうまく動作しなかったので今回は省略します。
既知の制限事項
Git Syncはまだ実験的な機能のため、いくつかの制限があります。導入前に確認しておきましょう。
同期できるリソース
現時点では、以下のリソースのみ同期可能です:
| リソース | 対応状況 |
|---|---|
| ダッシュボード | ✅ 対応 |
| フォルダ | ✅ 対応 |
| アラート | ❌ 未対応 |
| ライブラリパネル | ❌ 未対応 |
| データソース | ❌ 未対応 |
アラートやライブラリパネルは今後のアップデートで対応予定とのことです。(内心、アラートが早くリリースしてほしいと切望していたり….。)
その他の制限
- GitHubのみ対応: 現時点ではGitHub以外(GitLab、Bitbucket等)は未対応
- GitLab、Bitbucketは今後のロードマップに含まれています
- GitHub Appsは未対応: Personal Access Token (PAT) のみ利用可能
- プロビジョニングされたフォルダの権限: 同期後はフォルダの権限を変更できない
- Full Instance Sync時の制限: アラートやライブラリパネルがあるとブロックされる
パフォーマンスへの影響
公式ドキュメントによると:
When Git Sync is enabled, the database load might increase, especially for instances with a lot of folders and nested folders. Evaluate the performance impact, if any, in a non-production environment.
(Git Syncを有効にすると、特に多くのフォルダやネストしたフォルダがあるインスタンスでは、データベースの負荷が増加する可能性があります。本番環境以外で、パフォーマンスへの影響を評価してください。)
と記述があるのですが、どれくらいの影響があるかは定かではないのでもう少し調べてみようと思います。
まとめ
Git Syncは、長年Grafanaユーザーが待ち望んでいた機能の1つではないかなと思いますが、まだまだOSSへのリリースの道のりは険しそうな気がしています。
しかし、GAされた暁にはこれまで抱えていたメンテナンスコストはグッと減るのでは?と思っているので、今後のアップデートには乞うご期待です。
良いところ
- ネイティブ統合: 外部ツール不要でGit管理が可能
- 双方向同期: UIからの編集もGitからの編集もOK
- PRワークフロー: レビュープロセスを自然に組み込める
- セットアップが簡単: GUIから数クリックで設定完了
注意点
- まだ実験的な機能(本番利用は慎重に)
- ダッシュボードとフォルダのみ対応(アラートは未対応)
- GitHubのみ対応(GitLab、Bitbucketは今後)
今後に期待
- アラート、ライブラリパネルの対応
- GitLab、Bitbucketへの対応
- GitHub Appsのサポート
まだ実験的な段階ですが、もし興味のある方は試してみてください!!
最後に
明日の Grafana Advent Calendar 2025 もお楽しみに!